54 Customer Retention Statistics Proving The Value Of Loyalty
Customer retention is statistically one of the best marketing strategies. Businesses that focus on customer retention, instead of acquiring new customers, boost their bottom line, earn more money per customer, and subsequently spend less money on marketing overall.
Let’s delve deeper into the available stats and research to show you why customer retention continues to remain so important to your business.
Customer Retention Statistics
Existing customers that are loyal to your brand are easier to market to, convert more frequently, and cost less to retain. Companies and businesses that shift their marketing focus towards increasing customer retention can grow their businesses without growing their costs.
- Customer acquisition costs five times more than satisfying and retaining existing customers (Forrester).
- A 5% increase in customer retention can increase a business’s profits by 25-125% (Customer Thermometer).
- 63% of consumers claim they would share more personal information with brands that offer positive customer experiences (PWC).
- 65% of a company’s business is likely to come from existing customers (Dun & Bradstreet).
- 91% of consumers are more likely to do business with brands that recognize, remember, and provide them with relevant personalized offers and recommendations (Accenture Interactive).
- American companies lose some 136.8 billion USD per year due to avoidable customer loss (CallMiner).
Customer Loyalty Statistics
Customer loyalty can be a result of many things. In general, though, loyal customers associate any favorable experiences they have with a brand leading to repeat purchases, increased conversions, and higher spending.
Without happy customers that are loyal to your brand, your business is more likely to spend more on customer acquisition which, in the long run, will affect your bottom line. Therefore keeping your customers satisfied and coming back for more is critical to any business’s success.
Here are a few key customer loyalty stats that will help emphasize this further.
- 26% of consumers feel more loyal to brands, whereas, 21% of consumers feel more loyal to the products they sell (InMoment).
- 37% of American customers deemed themselves loyal to a brand after at least five purchases (Yotpo).
- 50% of loyal customers have switched to competitors who are more relevant to their purchasing considerations and better able to satisfy their needs (InMoment).
- 50% of customers do business with a brand more frequently after a positive customer experience (New Voice Media).
- 80% of customers gradually developed loyalty for a brand over time. This was predominantly due to excellent products, good customer service, positive customer reviews, and staff knowledge and advice (InMoment).
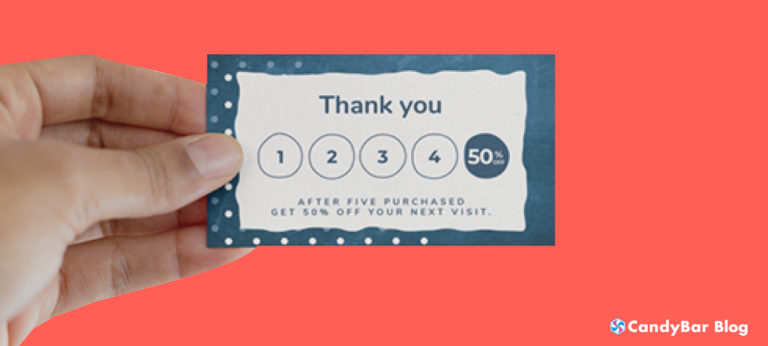
- 81% of customers are more likely to be loyal to a brand that offers a customer loyalty program (Bond Brand Loyalty).
- 90% of American customers claim they are now equally or are more loyal than they were to their preferred brands compared to a year ago (Yotpo).
- 97% of consumers claimed they are more likely to be loyal to a brand if it implements their feedback (Apptentive).
Looking to improve customer loyalty? Consider using a loyalty card app.
Repeat Customer Statistics
Increasing your business’s profitability should always start with your repeat customers. Repeat customers not only spend more on a more frequent basis but they also help to encourage new customers to walk through your door.
Customers acquired by existing customer recommendations and referrals are also incredibly valuable. You’ve basically spent no money to sway them to do business with your brand plus they are more trusting of your services than most other new customers.
Here are some important stats to help you understand this further.
- 33% more is spent by repeat customers compared to new customers (Customer Thermometer).
- Repeat customers spend more with a business the longer they use their services. For example, repeat customers spend 67% more in the months 31-36 compared to months 0-6 (Bain and Company).
- 80% of a business’s profits come from your existing customers, they only make up 20% of your customer base (Customer Thermometer).
- 81% of people trust recommendations from friends or family over those from businesses (HubSpot Research).
- 90% of consumers are likely to purchase more from a business than once (HubSpot Research).
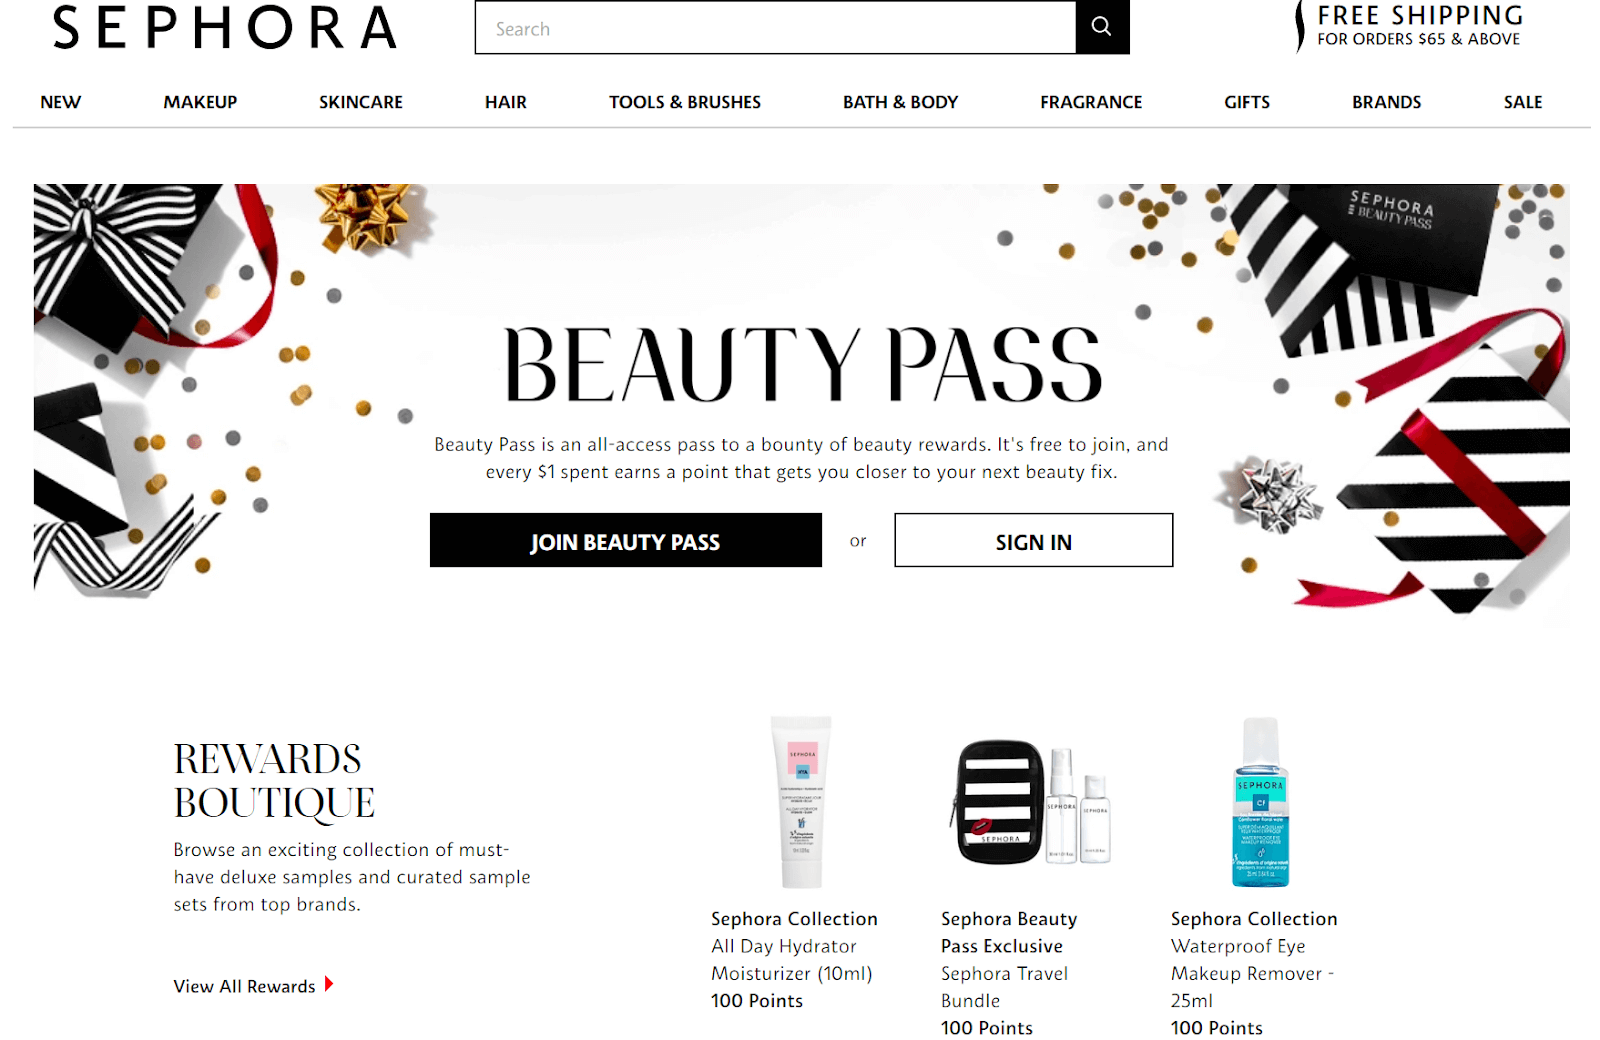
80% of Sephora’s annual sales come from repeat customers – via its Beauty Pass rewards program
Customer Satisfaction Statistics
To be successful your business or company needs to keep your customers as satisfied as possible. Satisfied customers are happy customers, they’ll spend more, recommend you to others, and require less from your business than new customers will.
Most importantly, though, customer satisfaction is the key to creating long-lasting and meaningful relationships between your brand and your valued customers. Which, by now, you probably can guess is great for business.
Take a look over these customer satisfaction stats and you’ll see what I mean.
- Little more than 10% of customers were willing to stay on a call for more than five minutes when seeking customer support (Genesys).
- 32% of customers claim they would cease doing business with a company they loved after just one bad experience (PWC).
- 40% of customers will commence doing business with a competing brand that has a reputation for good customer service (Zendesk).
- 42% of customers will do business with a competing business if they experience an interaction with a rude or unhelpful staff member (New Voice Media).
- 53% of customers will switch to a competing brand if they feel unappreciated (New Voice Media).
- Upwards of $62 billion USD is lost per year by American companies directly related to poor customer service (New Voice Media).
- 69% of American customers claim they would spend more money with companies that provide better customer service (Forrester).
- 60-75% of people will do return business with a brand if they feel a customer service issue has been dealt with fairly, regardless or not if the result fell in their favor (Customer Thermometer).
- 80% of companies believe they provide superior customer service, however, only 8% of their customers agree with them (Customer Thermometer).
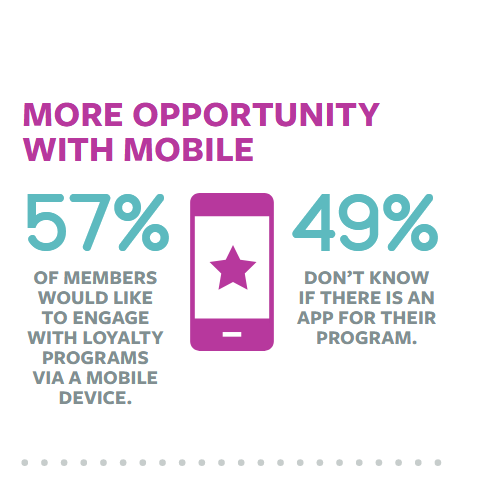
- 90% of millennial customers prefer smartphones for customer support and aftersales service (Genesys).
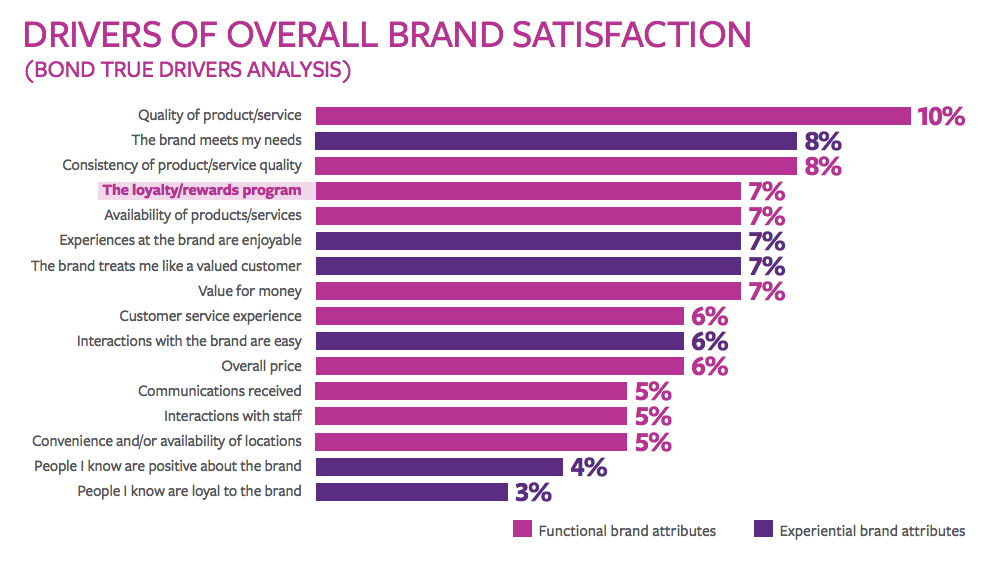
A loyalty rewards program is in the top 5 drivers of customer satisfaction
Customer Journey Statistics
Looking at your business from the perspective of a consumer is a must if you wish to tailor your products and services to meet all your customer’s wants and needs. In order for your business to be a success, every process along the customer journey must have your customer’s best interests at heart.
If you can optimize this journey and make interacting with your brand as seamless as possible, you have taken a huge step in the right direction and helped to secure the success of your brand.
Here are some customer satisfaction stats every business owner or marketer should know.
- One out of three customers claims they would pay more to receive higher levels of customer service (Genesys).
- 25% more customer retention and revenue is as a direct result of a commitment customer experience results (Customer Thermometer).
- 29% of customers will make the switch to a competing brand if they feel a staff member lacks sufficient product knowledge (New Voice Media).
- 31% of customers rated their ability to contact a brand through any means the top driver of establishing an emotional connection to a company (New Voice Media).
- 32% of customers will switch to a competitor if they feel they are sick of being referred to multiple staff members (New Voice Media).
- 40% of consumers claim they would pay extra for same-day delivery services (PWC).
- 50% of customers claim they would switch to a competitor brand after just one bad experience. That number rises to around 80% when more than one bad experience occurs (Zendesk).
- 54% of consumers claim customer experience at most companies could use some improvement (PWC).
- 64% of people claim that positive customer experiences are more important than a service or product price (Gartner).
- 66% of customers feel valuing their time is the most important matter a company can do to provide them with a positive experience (Forrester).
- 69% of consumers shop more with retailers that offer consistently online and offline positive customer services (Forrester).
- 73% of customers claim an interaction with a friendly staff member can make them fall in love with a brand (RightNow).
- 80% of consumers say that speed, convenience, staff knowledge, and friendly service are the top most important aspects of a positive customer service experience (PWC).
- 86% of customers are happy to pay up to 25% more for products that stocked by a brand that has provided them a positive customer experience (RightNow).
- 89% of customers have switched to a competitor at least once in the last 12 months (New Voice Media).
Brand Loyalty Statistics
Up your customer service game, provide good aftersale service, offer quality goods and services, and keep your customers satisfied. In doing so, your customers will reward your business with higher sales volumes, frequent purchases, and increased customer retention.
Take a look through these brand loyalty stats and see why it’s in your best interest to keep your customers coming back again and again.
- 20% of satisfied customers intend to leave and take their business elsewhere (Harvard Business Review).
- 28% of dissatisfied customers claim they would stick with a business even though they were unhappy with the product or services provided to them (Harvard Business Review).
- 52% of customers claim they will go out of their to do business with a brand they are loyal to (Zendesk).
- 52% of American customers will join a brand’s customer loyalty program with a preferred company (Yotpo).
- 60% of loyal customers will make purchases from their preferred companies more frequently (InMoment).
- People with an emotional relationship with a brand recommend them at a rate of 71% compared with the average rate of 45% (Motista).
- 77% of people claim they would recommend a business to a friend after a positive experience (Ternkin Group).
- 77% of customers have maintained loyal to a preferred brand for 10 or more years (InMoment).
- Customers with an emotional attachment to a brand have a 306% higher lifetime value (Motista).
- Emotionally-attached customers will, on average, spend $699 USD with a company per year compared with other satisfied customers that spend $275 USD (Motista).
Final Thoughts
Now more than ever, with the amount of choice at everybody’s fingertips, people are increasingly able and willing to abandon your business and switch to another brand as it suits them.
Keeping your customers happy and satisfied is going to be the difference between your business or company simply surviving or absolutely thriving.
The statistics we’ve compiled here demonstrate this perfectly. All trends point to an industry that is going to continue to evolve, change, and shift, bringing with it even greater opportunities and rewards.
If you can nail good customer service, provide quality products and services, and boost your customers’ satisfaction, you’re well on the way to taking your business to that next level.
Are you still in the mood for some more stats?
If you’re interested in boosting your word-of-mouth marketing strategy, check out ReferralCandy and InfluencerCandy!